Dissertation Project by Kyle Bonallo, 2015
BSc (Hons) Computer Science, Final Year, Heriot-Watt University Edinburgh

Background
Petroleum Engineering university courses often focus on the scientific and geological aspects of oil production. E.g.
- Rock Types and Formations.
- Flow rate, viscosity, volume, density, etc.
The business aspect of the industry is more difficult to teach and harder to test in exam situations. As a result, students often miss out on:
- How projects are managed and structured
- What physical infrastructure is required
- Timescales
The industry is also based heavily on predictions made from data analysis.
There are few certainties in the industry, and often the facts only become clear once the investment has been made and drilling has commenced.
Project Aims & Objectives
The primary aim:
To determine if the use of serious games can improve user understanding of the Petroleum Industry.
Key Project Objectives:
Investigate the project domain.
Design a game concept and rule-set.
Develop a prototype web application that successfully models the game concept (Fantasy Oil Game (FOG)).
Game Overview
FOG is resource-based strategy game that sees teams of 4/5 players compete in a fantasy game world.
Teams must turn $ into Oil
The game runs in rounds lasting a fixed amount of time.
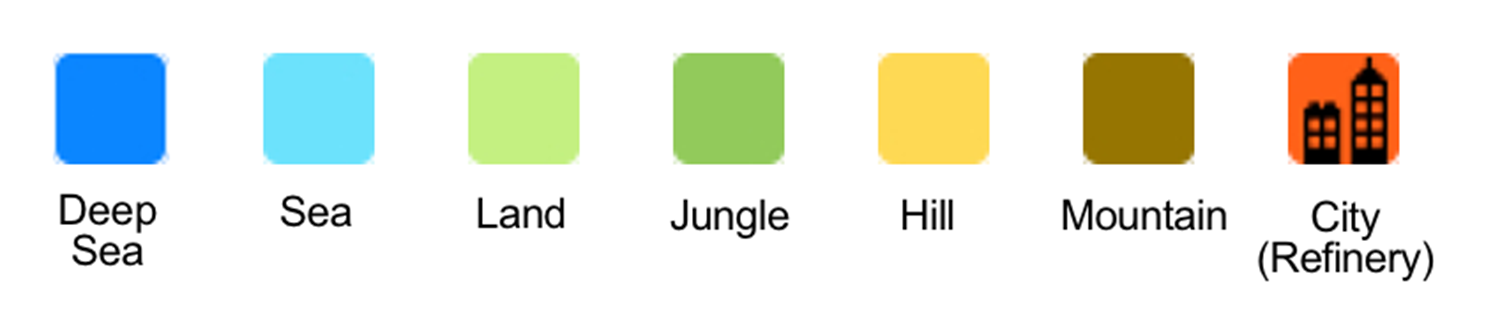
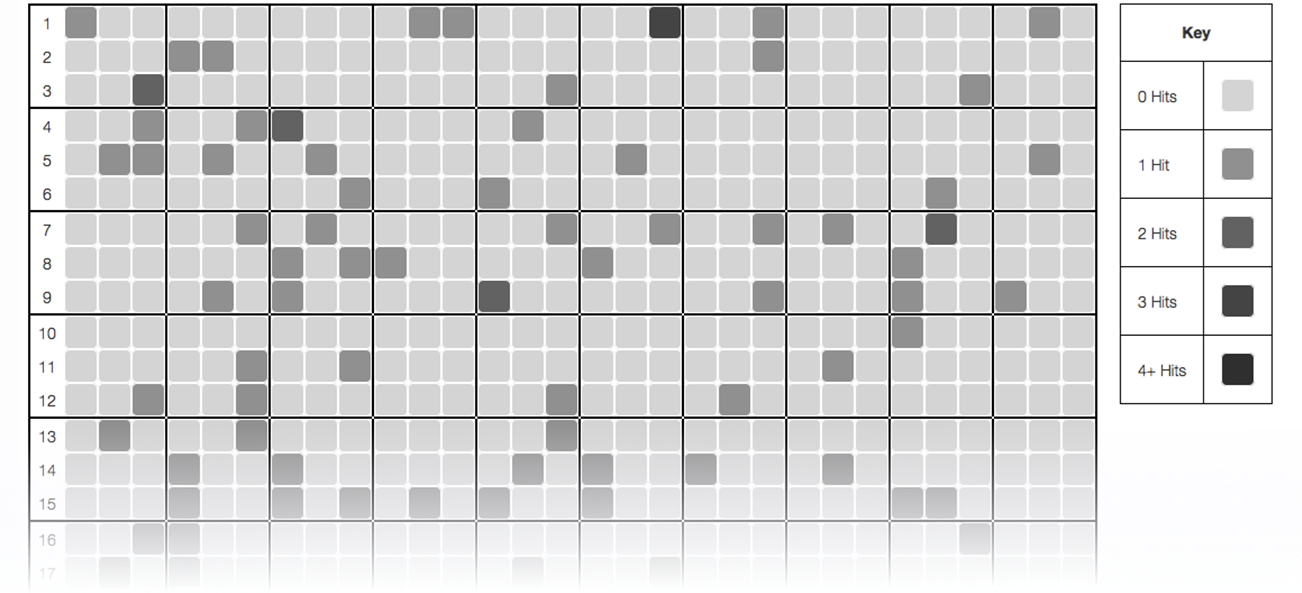
The Game Map
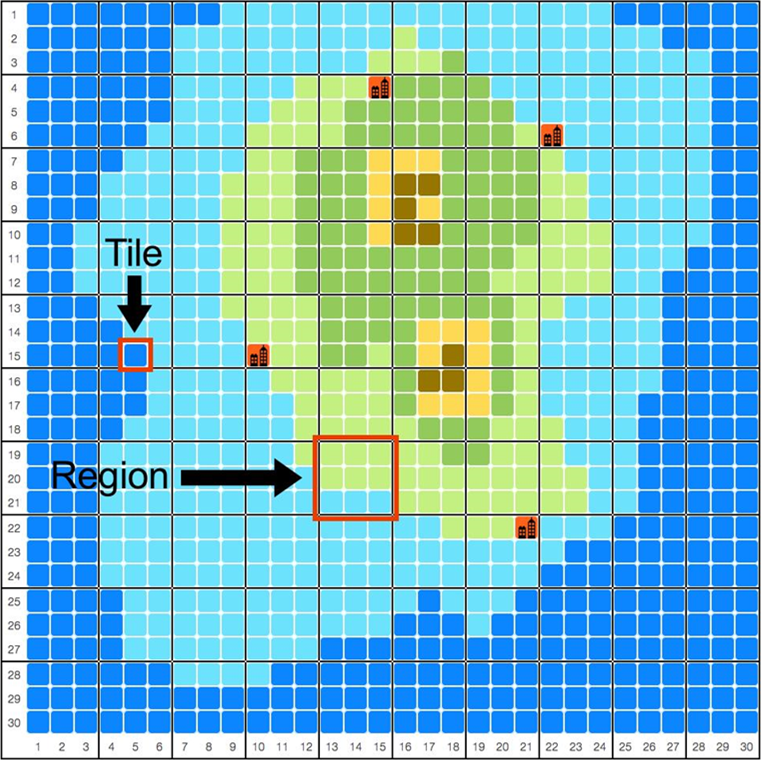
Gameplay Part 1: Exploration
Exploration Tools: Heat Map ($)
Teams can purchase additional exploration data to better inform their decisions.
Gameplay Part 2: Bidding for a region
When teams find an area that they believe shows good potential oil stores: they can place a bid.
This is designed to replicate the real-world bidding process and requires teams to:
- Declare a promised number of exploratory wells.
- Declare a drilling timeframe for the wells.
The winning team is the one who bids highest investment in drilling, in the shortest time.
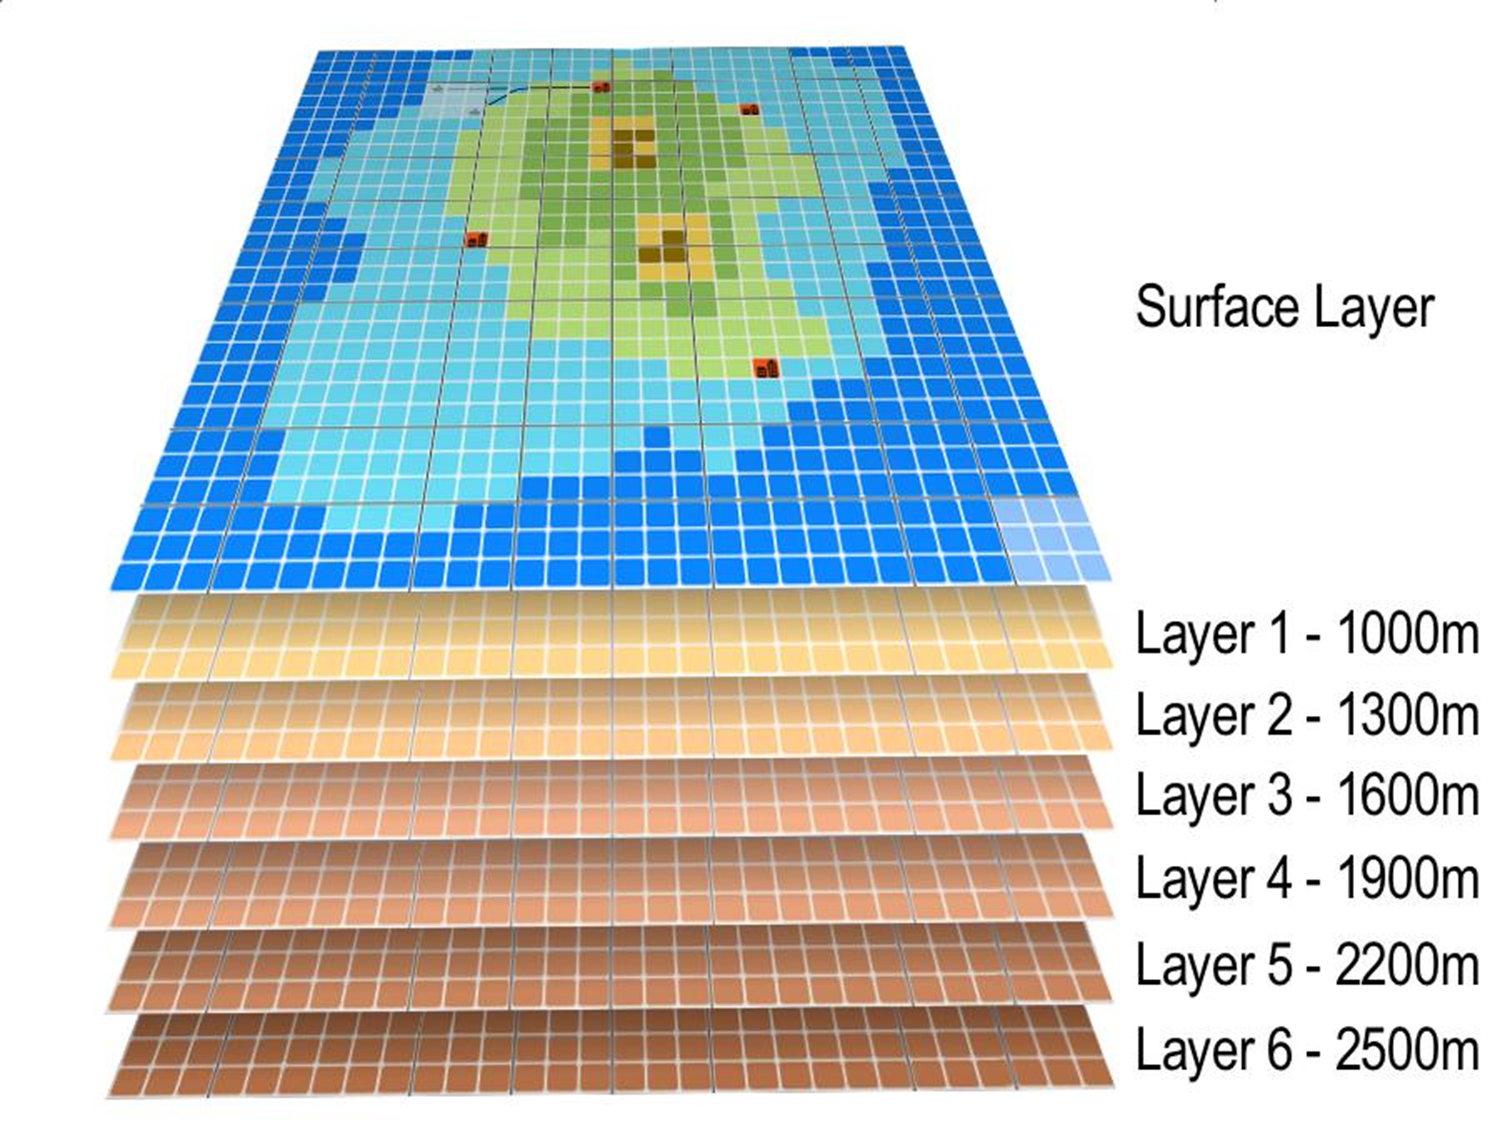
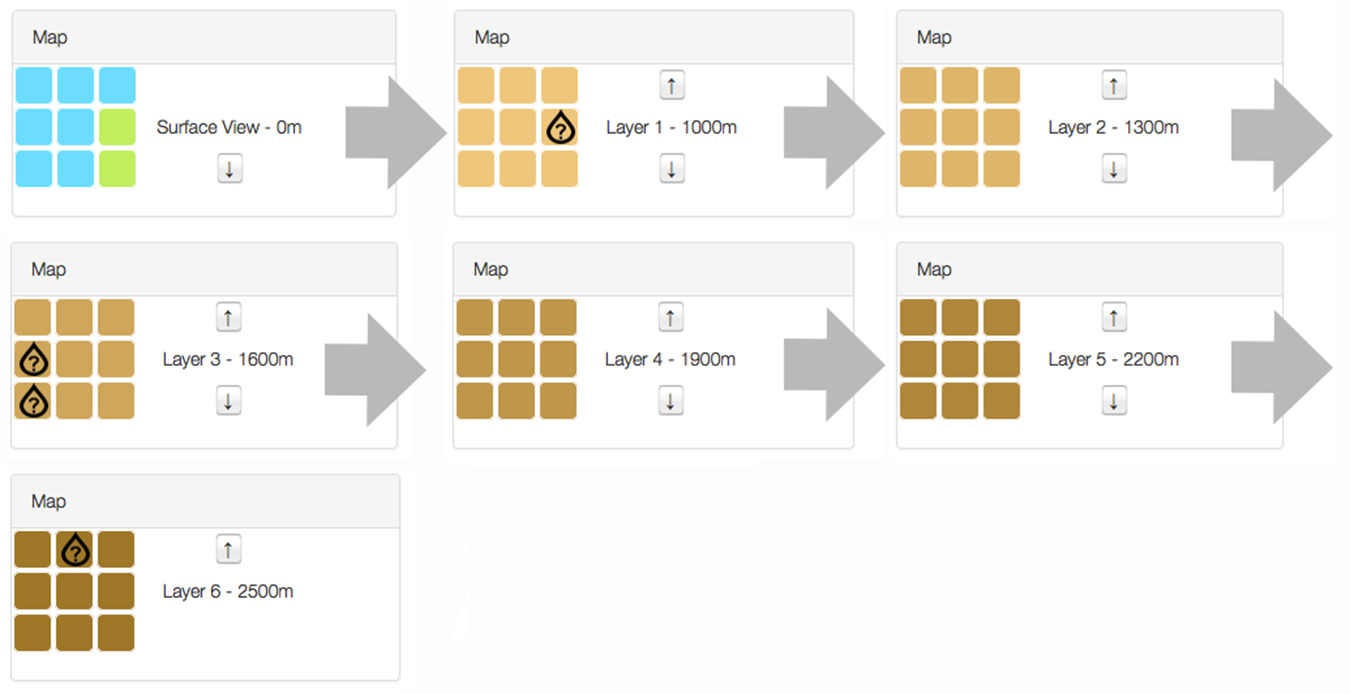
Gameplay Part 3: Running Simulations
When a region is acquired teams can begin drilling exploration wells.
These wells will unearth clearer information about the oil reservoir below:
- They aid prediction of how much oil may be down there.
- More wells = more accurate prediction.
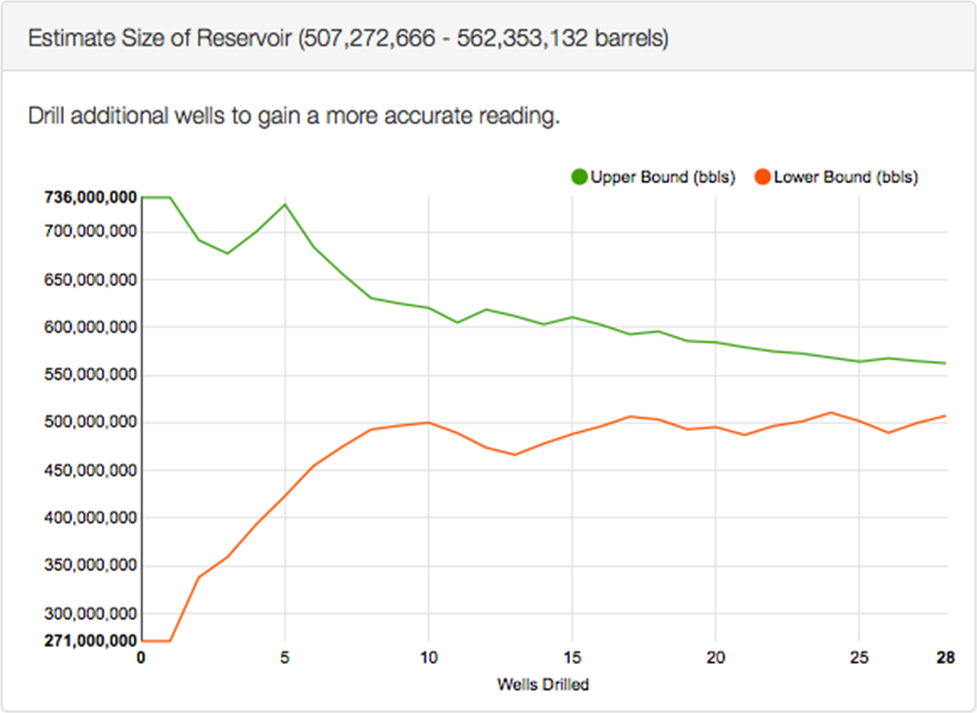
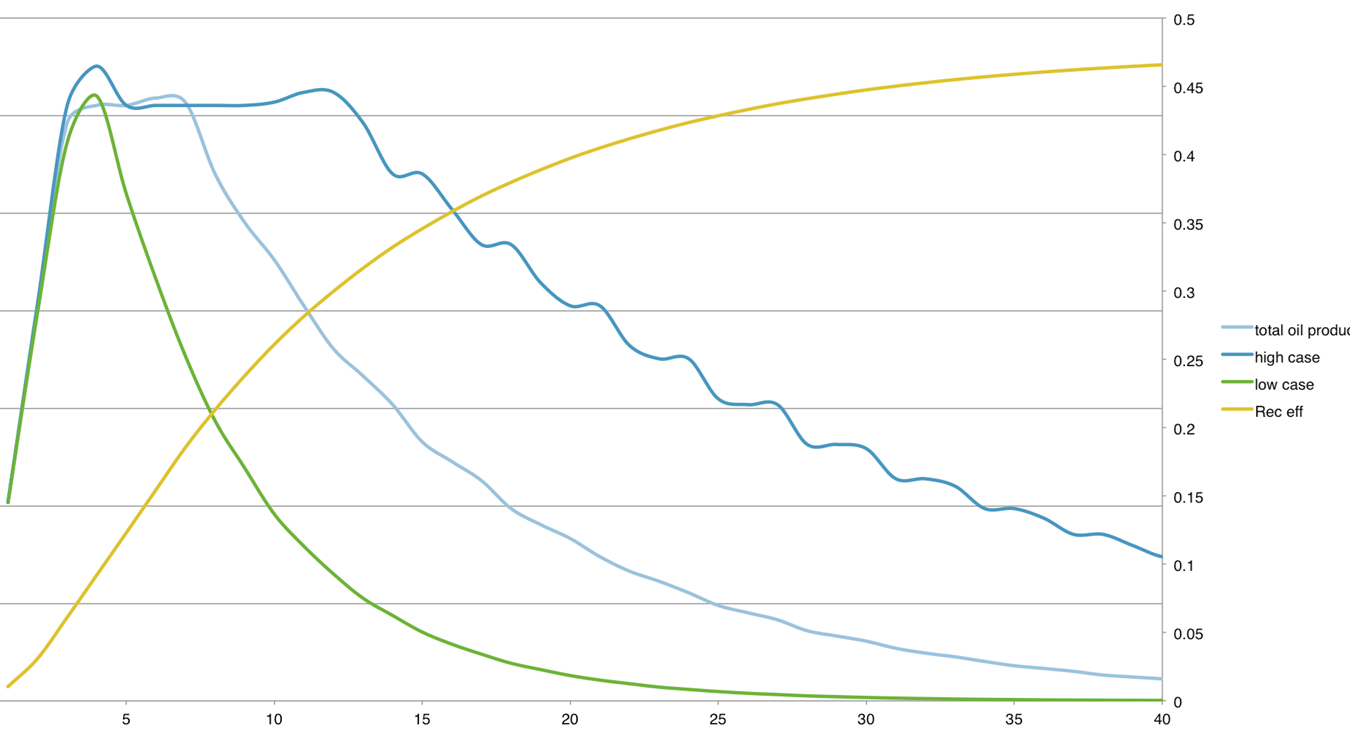
Estimate of Reservoir Size (Over time)
The graph below illustrates that as the number of exploratory wells increases, the accuracy of the estimated reservoir size improves.
Exploration wells are much cheaper than production wells (in the region of 5x less) due to:
- Narrower diameter and lower stress requirements
- Easier to install thanks to drill rigs/ships.
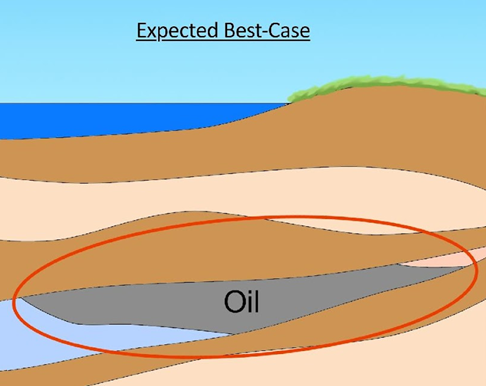
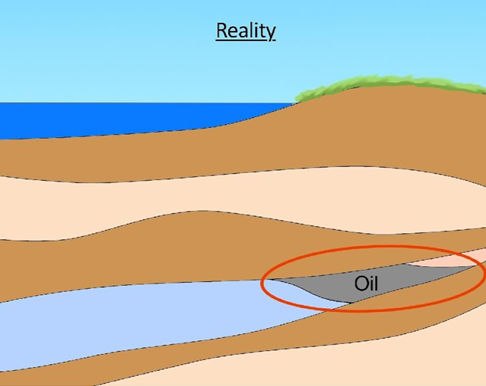
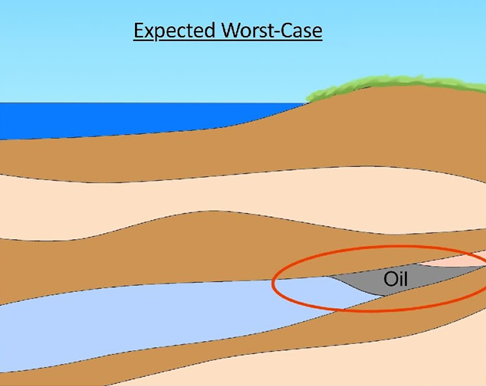
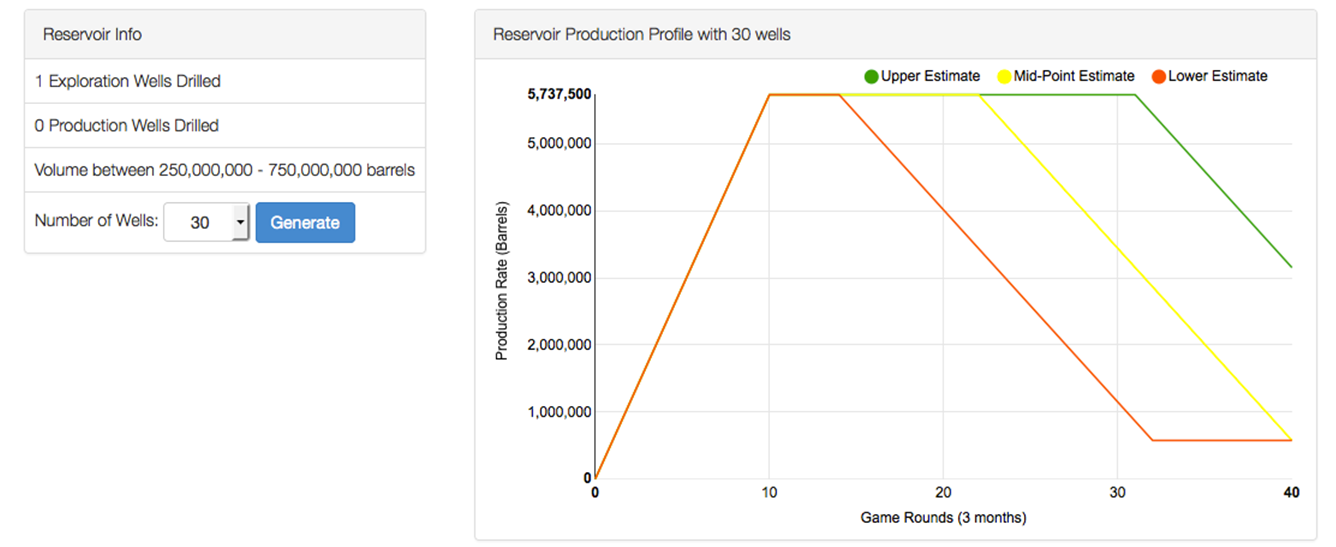
Reservoir Simulations (with few Exploration Wells)
Reservoir Simulations (with many Exploration Wells)
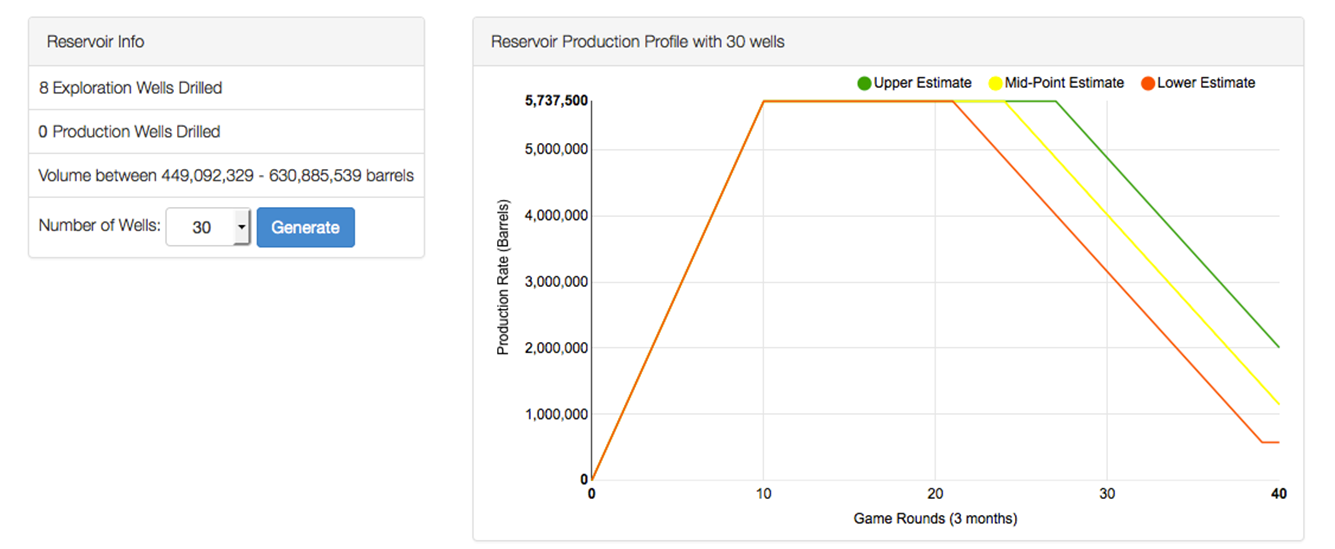
The simulation process encourages students to invest in reducing the risk early on and not gamble with building expensive wells based on little/no data.
Gameplay Part 4: Development
Once a team decides to go ahead with a site:
- They build oil platforms.
- Drill production wells.
- And build pipelines to transport the oil to one of the refineries on the map.
At this point, teams should follow a plan based on their reservoir simulations to determine how many wells will provide optimal recovery.
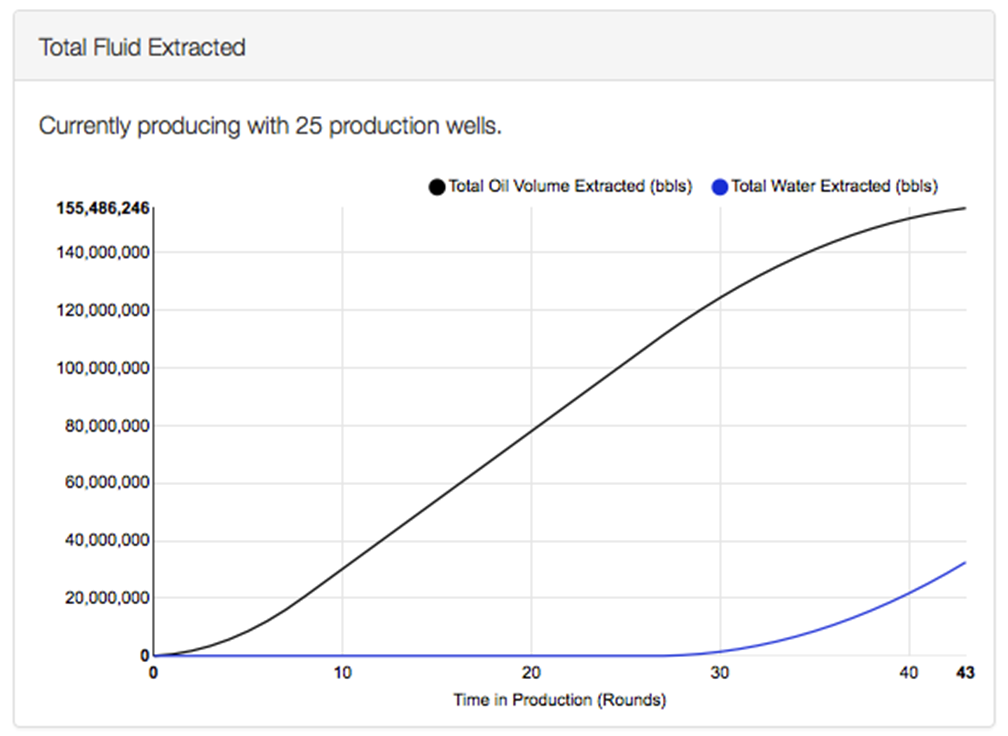
Balance: Recovery Speed vs. Cost
Monitoring Oil Production